Obesity Data Analysis Project
Obesity results from a chronic imbalance of calories consumed and calories used by the body for its metabolic and physical functions. It may also be genetic in some individuals, but this is rare. Today, the rising prevalence of obesity can be attributed to our environment: ready access to high-calorie foods but limits to our opportunities for physical activity. Obesity is a disease that can negatively impact quality of life as well as health. How can we use data to examine obesity in individuals and come up with insights to help those seeking to minimize diet and behavior that lead to obesity?
Our project looks obesity levels based on eating habits and physical condition in individuals from Colombia, Peru and Mexico. The data contains 17 attributes and 2111 records, the records are labeled with the class variable NObeyesdad (Obesity Level), that allows classification of the data using the values of Insufficient Weight, Normal Weight, Overweight Level I, Overweight Level II, Obesity Type I, Obesity Type II and Obesity Type III. 77% of the data was generated synthetically using the Weka tool and the SMOTE filter, 23% of the data was collected directly from users through a web platform.
Some questions we will answer:
- How does obesity span across gender for this population?
- How does obesity span across age?
- Who is most predisposed to obesity based on family history?
- What eating habits are most correlated with obesity?
- By how much can clean eating habits reduce the likelihood of developing obesity?
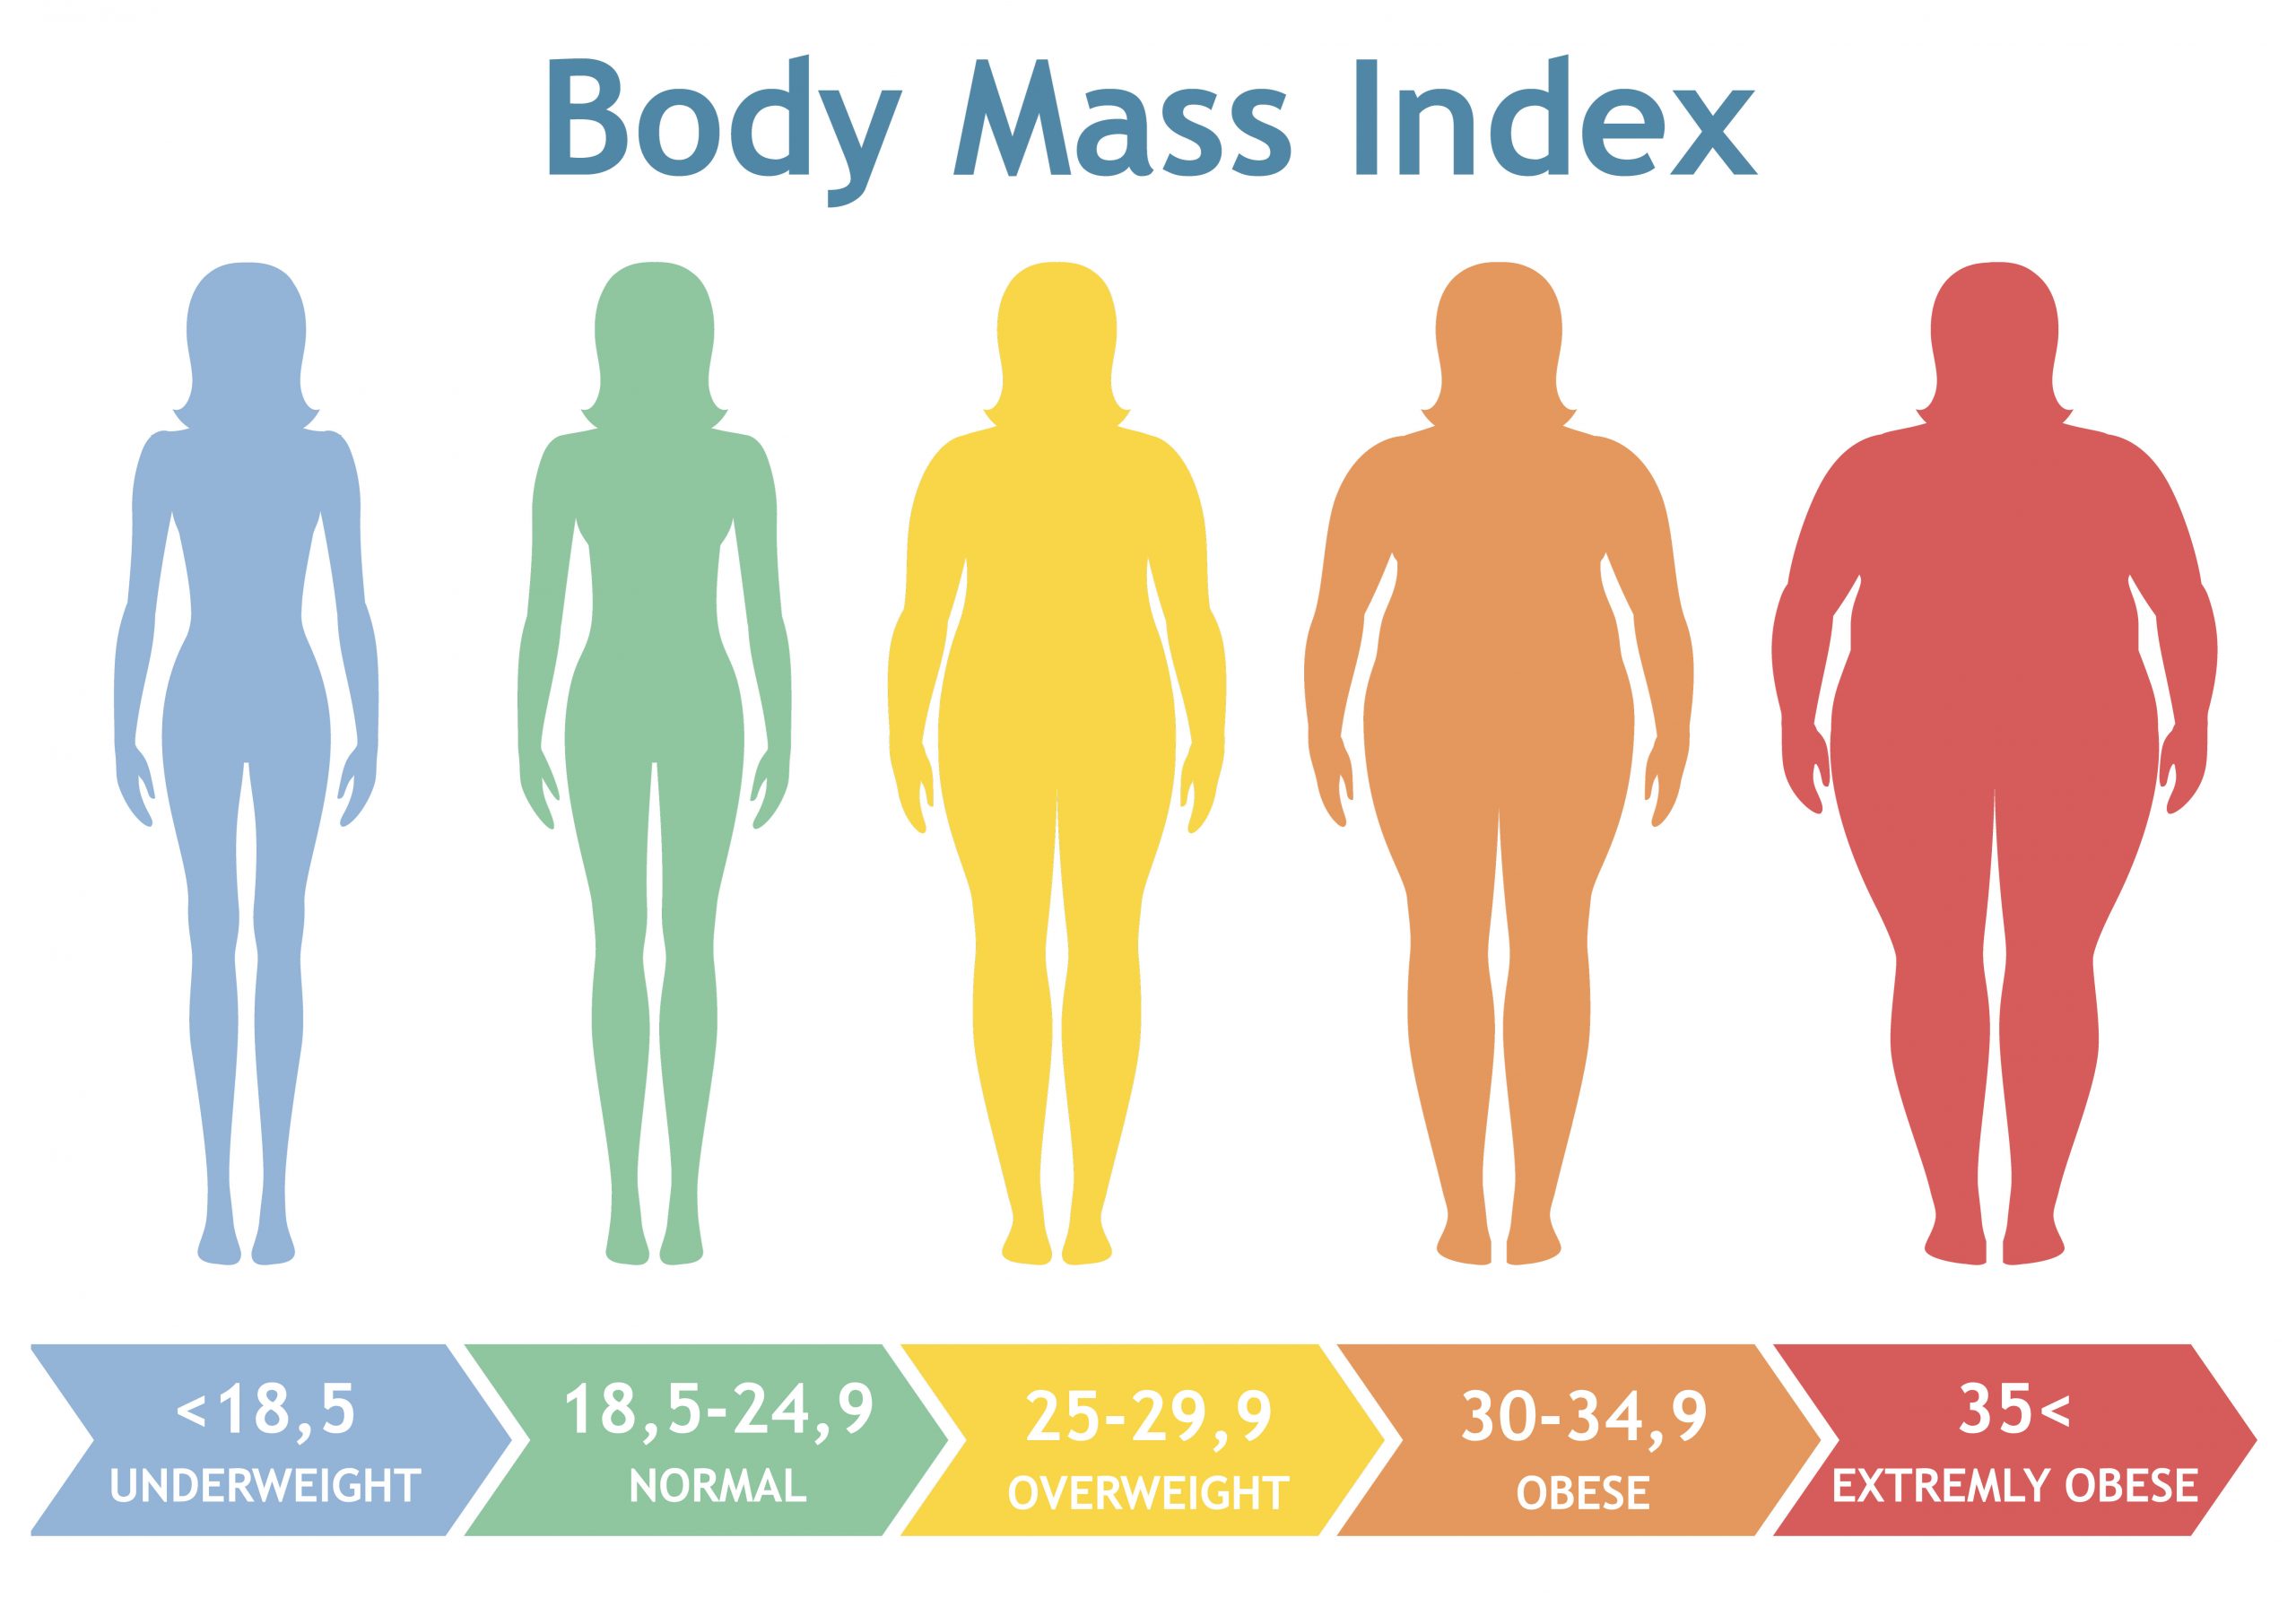
The levels of obesity described in this dataset are as follows:
- If BMI is less than 18.5, it falls within the Underweight range.
- If BMI is 18.5 to 24.9, it falls within the Normal Weight range.
- If BMI is 25.0 to 28.5, it falls within the Overweight Level I range.
- If BMI is 28.5 to 29.9, it falls within the Overweight Level II range.
- If BMI is 30.0 to 34.9, it falls within the Obesity Type I range.
- If BMI is 35.0 to 39.9, it falls within the Obesity Type II range.
- If BMI is 40.0 or higher, it falls within the Obesity Type III range.
Obesity Data Visualizations
.png)
.png)
.png)
.png)
.png)
.png)
.png)
.png)
.png)